SCOM alerts
Razni alerti koji se javljaju pod SCOM-om, i šta raditi po tim pitanjima.
1. Max Concurrent API reached in Server XYZ
MaxConcurrentApi is a registry key which specifies the maximum number of simultaneous, logon-related, application programming interface (API) calls that can be transmitted across a secure channel at any one time.
Windows Authentication, Exchange, SharePoint + LOB outages due to the low default value for MaxConcurrentAPI, which is a ceiling for the maximum NTLM or Kerberos PAC password validations a server can take care of at a time (link1).
Solution1 : Raise the MaxConcurrentApi registry value on the server or servers which are seeing the issue.
Soulution2 : U zavisnosti od verzije SCOM-a i njegovog update-a, ovo može biti lažna uzbuna (link2)
2. NTFS – Delayed Write Lost
Ako se ovo javlja za VM-ove (virtuelme mašine) koje su na VMWare-u, ovo se može ignorisati. U pitanju je VMWare bug (link).
3. SQL server “Stolen Server Memory”
Prvo šta je to :
Stolen memory describes buffers that are in use for sorting or for hashing operations (query workspace memory), or for those buffers that are being used as a generic memory store for allocations to store internal data structures such as locks, transaction context, and connection information. The lazywriter process is not permitted to flush Stolen buffers out of the buffer pool.
The memory is usually taken from Buffer Pool. If you run DBCC MEMORYSTATUS and the output shows you high Stolen Pages, this means that some process is stealing memory from buffer pool more that what is necessary and you need to find that process.
Rešenje1 : ako se ne ponavlja stalno, ovo je u rangu upozorenja.
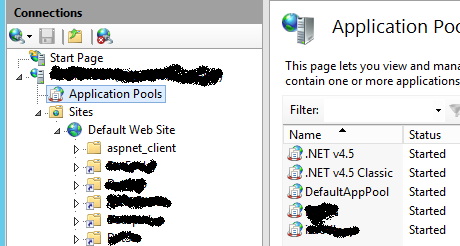
4. A process serving application pool ‘DefaultAppPool’ failed to respond to a ping. The process id was ‘3792’.
Otići u IIS Manager, kliknuti na “Application Pools”, i sa desne strane videti koji im je status (link) :
Šta još može da se proveri :
a) Količina slobodnog prostora na diskovima
b) Zauzeće CPU+RAM za dati vremenski interval
Ovakav problem se uglavnom reši sam (IIS sam restartuje dati AppPool), ali treba proveriti.
5. The transaction log for database ‘XYZW’ is full. To find out why space in the log cannot be reused, see the log_reuse_wait_desc column in sys.databases
Zbog čega se ovo dešava je odlično objašnjeno ovde.
*****
After the transaction is committed and after the data pages are preserved on disk, there is no need for SQL Server to hold on to the transaction log data anymore.
BUT
If you have your database set to recovery mode FULL, SQL Server does not reuse any part of the log file until it is backed up with a transaction log backup.
*****
Šta sve treba proveriti :
a) Da li još ima mesta na disku na kom je sama baza, i na kom su logovi (ne mora biti isti disk)
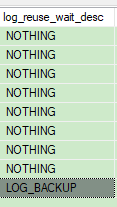
b) Kao što i sam opis greške kaže : log_reuse_wait_desc column iz sys.databases, što se radi kroz SQL upit postavljen kroz MS SQL SMS :
SELECT name,log_reuse_wait_desc FROM sys.databases;
The log_reuse_wait_desc column contains the reason why the SQL Server currently can’t reuse the log file of that database.
log_reuse_wait_desc : nvarchar(60) : Description of reuse of transaction log space is currently waiting on as of the last checkpoint.
Problem je što ovaj upit tranje letnji dan do podne, pa je jednostavnije pogledati direktno :
System Databases/master/Views/System Views/sys.databases/desni klik/”Select Top 1000 Rows”, i tu je i stavka “log_reuse_wait_desc” :
Svaki od ovih upita je vezan za po jednu bazu (prvo u spisku su sistemske baze, pa onda korisničke).
Evo linka ka značenju pojedinačnih kolona.
Zgodniji oblik upita :
SELECT TOP 1000 [name]
,[log_reuse_wait_desc]
FROM [master].[sys].[databases]
6. Memory pages per sec is too high
Uglavnom u nivou obaveštenja.
Treba obratiti pažnju da se ne dešava previše često.
Objašnjenje : Pages/sec is the rate at which pages are read from or written to disk to resolve
hard page faults (a hard fault happens when the address in memory of part of a program is no longer in main memory, but has been instead swapped out to the paging file, making the system go looking for it on the hard disk). This counter is a primary indicator of the kinds of faults that cause system-wide delays.
Granica za upozorenje se stavlja na osnovu baseline-a datog servera.
Dobar link.
Šta ova greška znači (ako se stalno ponavlja) : when this performance threshold has been exceeded it often means that the system is low on physical memory because the operating system is reading from the hard disk to recover information from the virtual memory.
7. Transaction was deadlocked on resources with another process and has been chosen as the deadlock victim. Rerun the transaction
Ovo je vezano samo za MS SQL servere.
“Transaction was deadlocked” error occurs when two or more sessions are waiting to get a lock on a resource which has already locked by another session in the same blocking chain. As a result, none of the sessions can be completed and SQL Server has to intervene to solve this problem. It gets rid of the deadlock by automatically choosing one of the sessions (the least expensive to roll back) as a victim and kills it allowing the other session to continue.
Deadlocks se mogu, od SQL 2008 naći u postojećim podacima, dok se pre ove verzije morali uživo “hvatati”.
Za MS SQL SMS i Server 2008 i novije deadlocks podaci se nalaze u SQL logovima (Management/SQL Server Logs) :
![]()
Na žalost ovo ne daje baš mnogo podataka.
Čak i za novije verzije SQL servera, deadlocks se moraju “hvatati” tako što se pusti trace (i to ne na dugo, jer su onda logovi OGROMNI!), jer se drugačije ne mogu dobiti tačni podaci vezani za to šta u aplikaciji pravi problem.
Rešenje : The only solution for handling deadlocks is to find the problem in your code and then modify your processing to avoid deadlock situations.